I built a leaderboard tracking 21 million AI-generated commits on GitHub
There's a lot of debate online about AI coding agents these days. Claude Code vs Codex vs Copilot vs Cursor. Everyone has a hot take, but most of it comes down to personal preference or whatever is trending on Twitter that week.
I wanted to look at actual data instead.
So I built Daily Agents, a live dashboard that tracks which AI coding agents developers are using across public GitHub repositories. It updates every 6 hours. The idea is simple: instead of relying on surveys or download numbers, look at the traces these tools leave behind in real code.
You can check it out at dailyagents.ai.
What it tracks
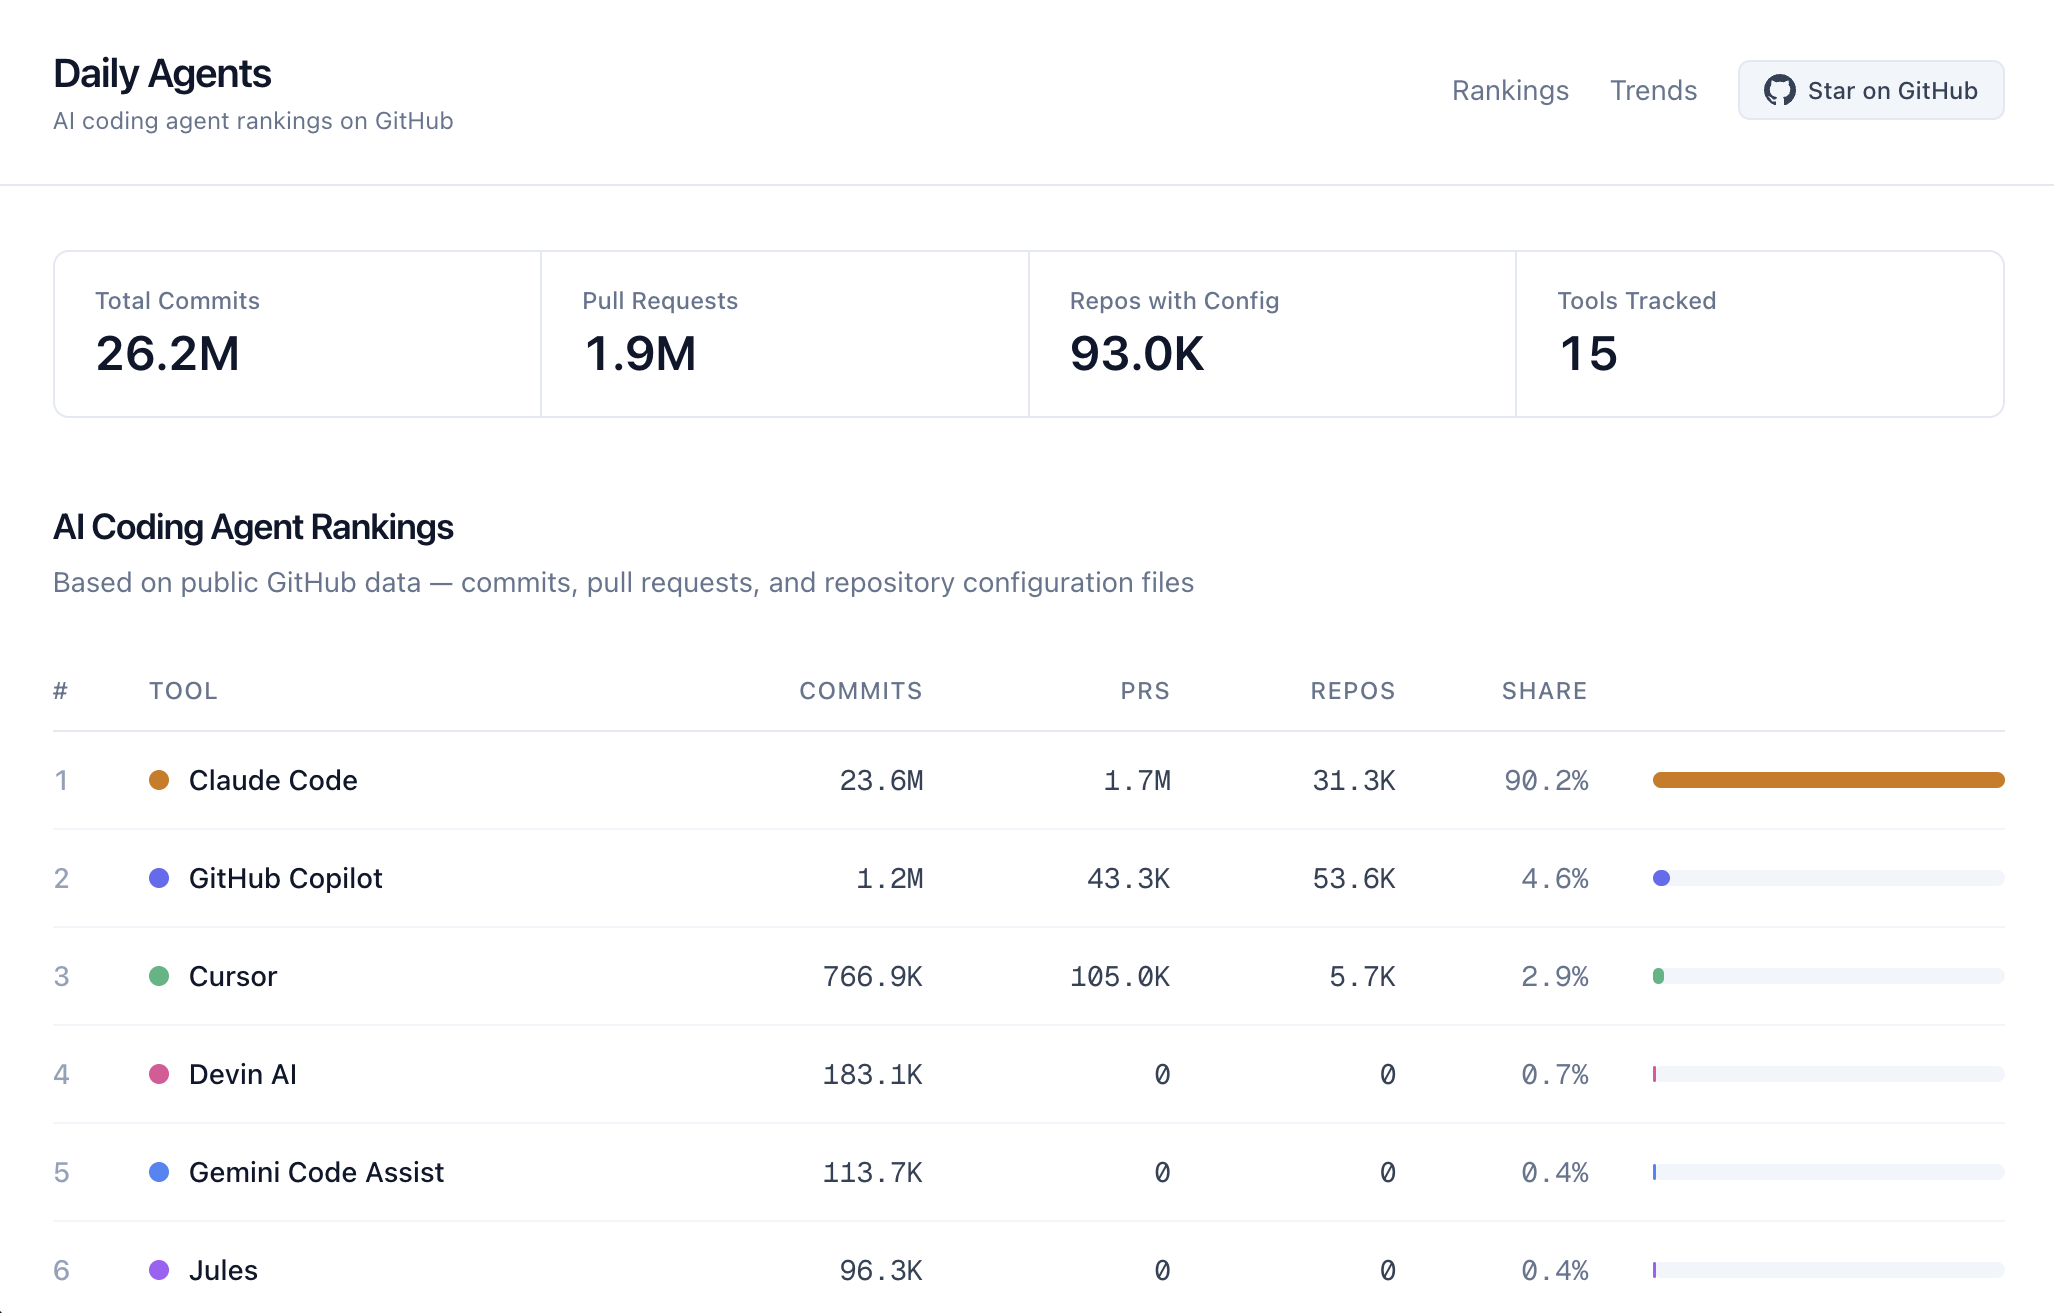
The dashboard currently shows:
- 21 million plus commits with AI co-author signatures
- 1.4 million plus pull requests generated by AI tools
- 82,100 plus repositories with AI tool config files
- 15 AI coding agents ranked side by side
It's a pretty large dataset at this point, and the picture is more nuanced than I expected going in.
How it detects AI tool usage
This is the part I find most interesting. AI coding tools actually leave fingerprints in your code without most people realizing it.
1. Commit co-author tags. When AI tools help write code, a lot of them add a Co-Authored-By line to the commit message, something like:
Co-Authored-By: Claude Code <noreply@anthropic.com>
This is probably the cleanest signal. It's explicit and standardized.
2. Pull request footers. Some tools add their name to PR descriptions. Claude Code puts "Generated with Claude Code" at the bottom. Other tools do similar things.
3. Config files in repos. Cursor creates .cursorrules files. Claude Code uses CLAUDE.md. Copilot has .github/copilot-instructions.md. If a repo has these files committed, someone on that team is using that tool.
The system checks GitHub's Search API for all of these signals across all 15 tools, every 6 hours, and stores daily snapshots in a database.
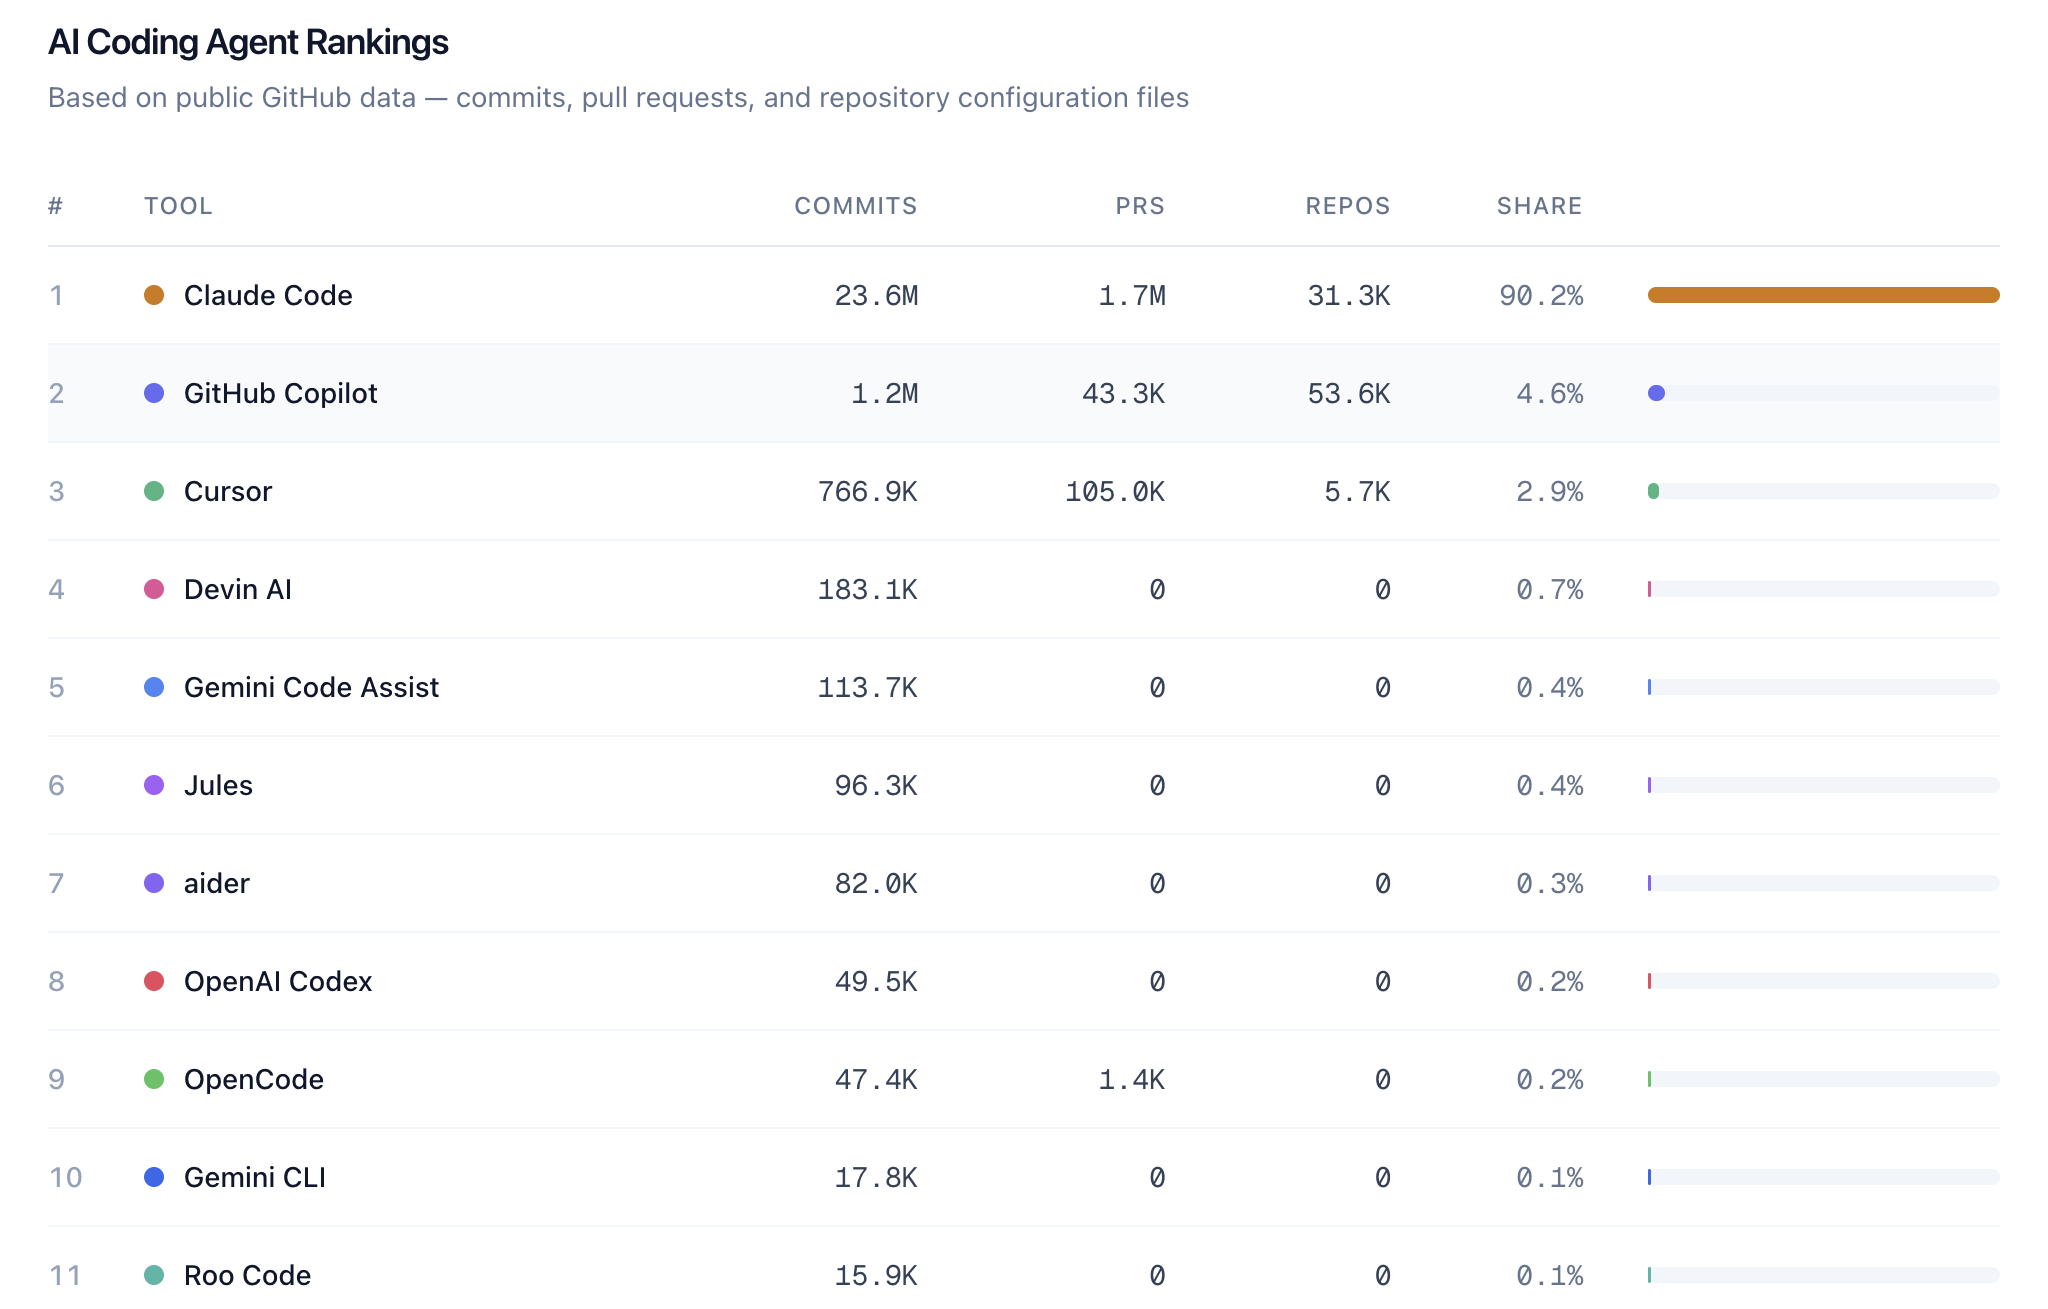
Current rankings
Here's roughly what the leaderboard looks like right now.
Leading the pack:
- Claude Code is way ahead in total commits
- GitHub Copilot has strong numbers across all signal types
- Cursor has huge config file presence and is growing fast in commits
Solid middle:
- Devin AI with interesting PR activity patterns
- Gemini Code Assist showing steady growth
- Junie which is newer but showing up more and more
Up and coming:
- aider is popular in the open source community
- OpenCode is relatively new and gaining traction
- Roo Code is slowly climbing
- Gemini CLI is Google's CLI entry starting to appear
The trends tell a more interesting story
Rankings are cool, but honestly the 180 day trend charts are where things get really fun.
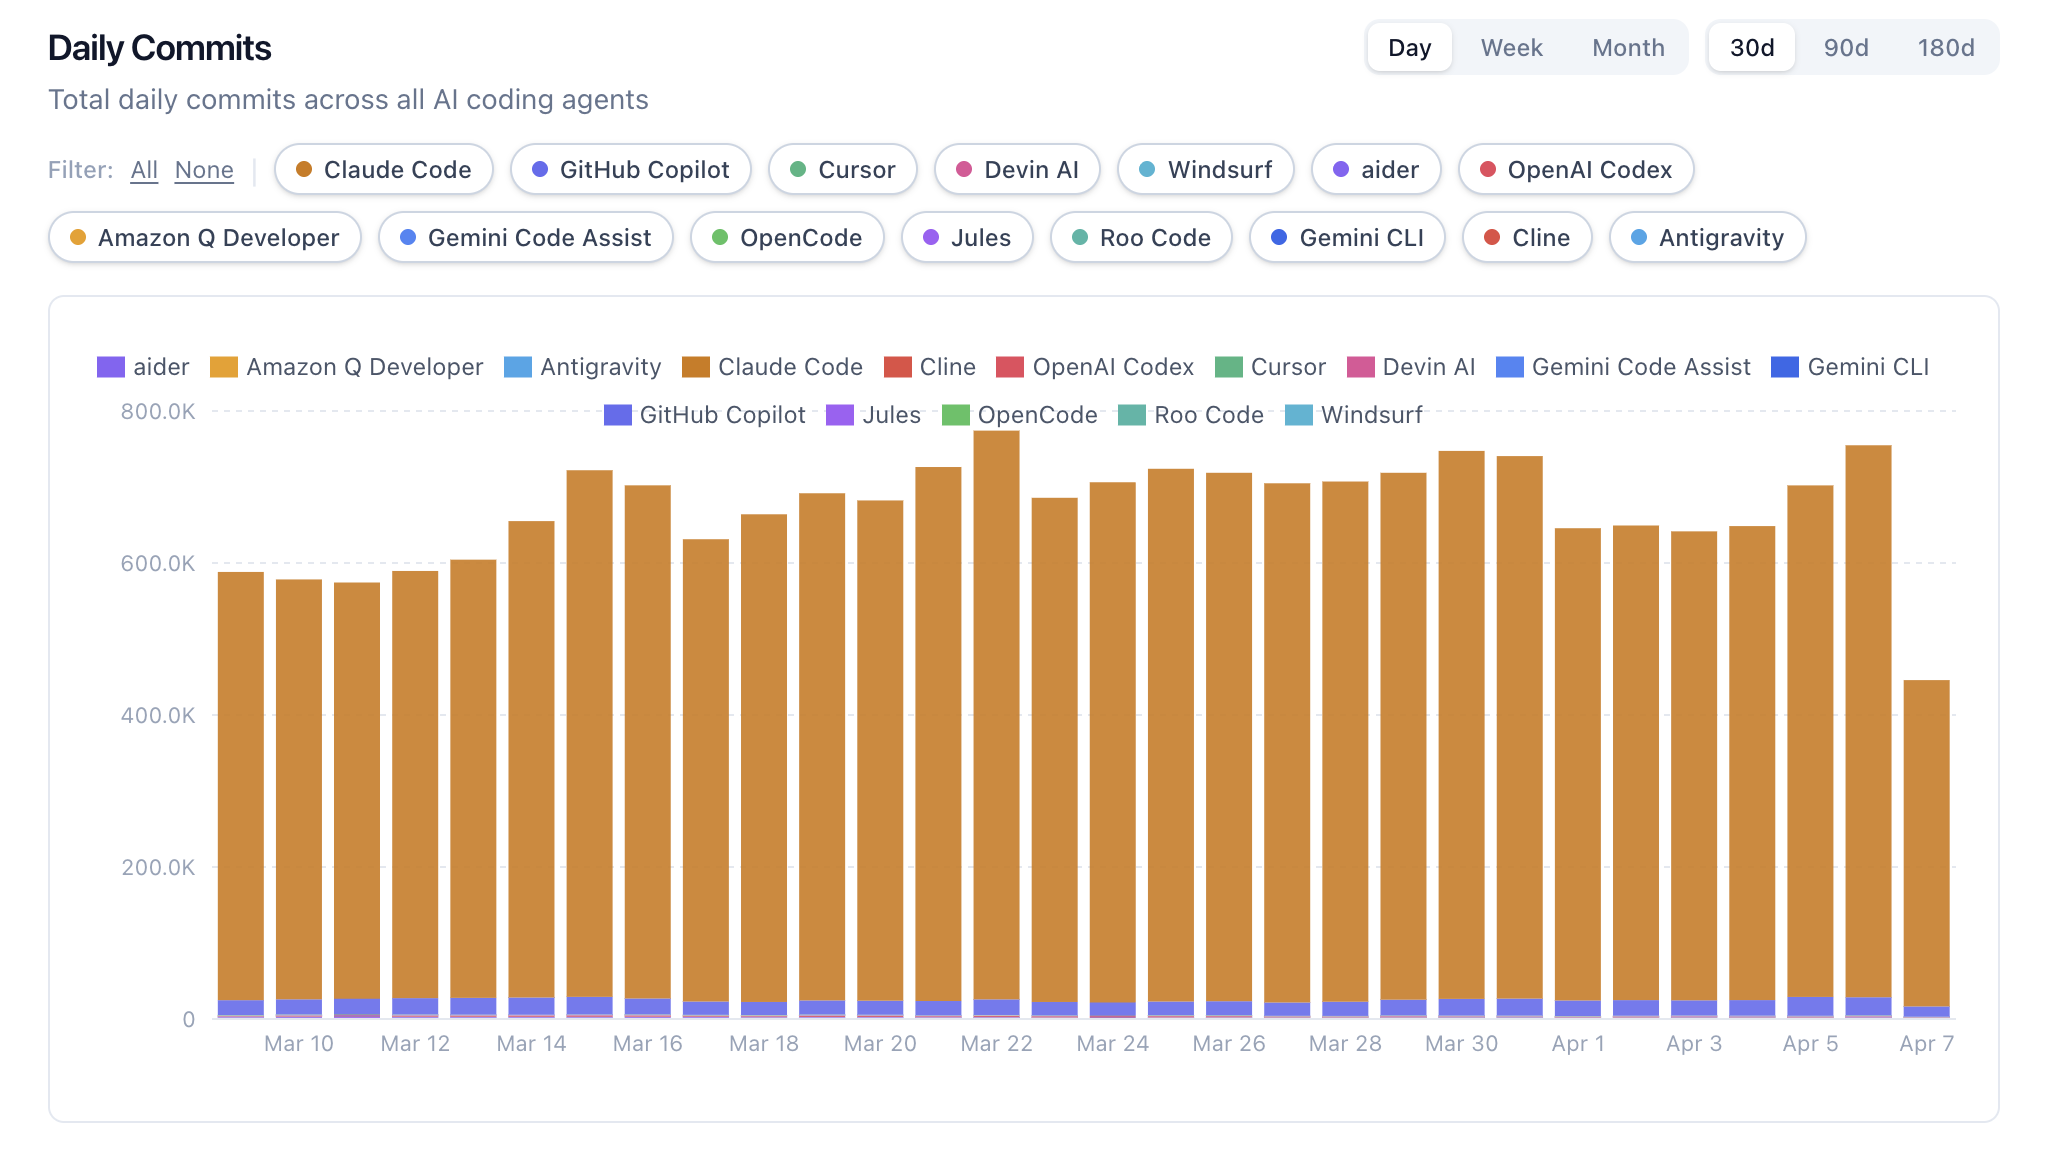
A few things that stood out to me.
Claude Code is growing fast. Like, really fast. It went from relatively modest numbers to leading the daily commit charts. The growth curve is noticeably steep compared to everything else.
Copilot has huge numbers but the growth has leveled off. It's still massive in absolute terms, but the trajectory looks flat. It's the established player that everyone already adopted, so there isn't as much room to grow.
Cursor has really deep adoption. The .cursorrules config file signal is interesting because it means developers aren't just trying Cursor once. They're setting it up, customizing it, and committing those settings to their repos.
There are a lot of smaller tools adding up. aider, Junie, Roo Code, Gemini CLI. None of them are huge on their own but together they represent a growing chunk. The market seems to be getting more diverse, not less.
Per-tool trend lines
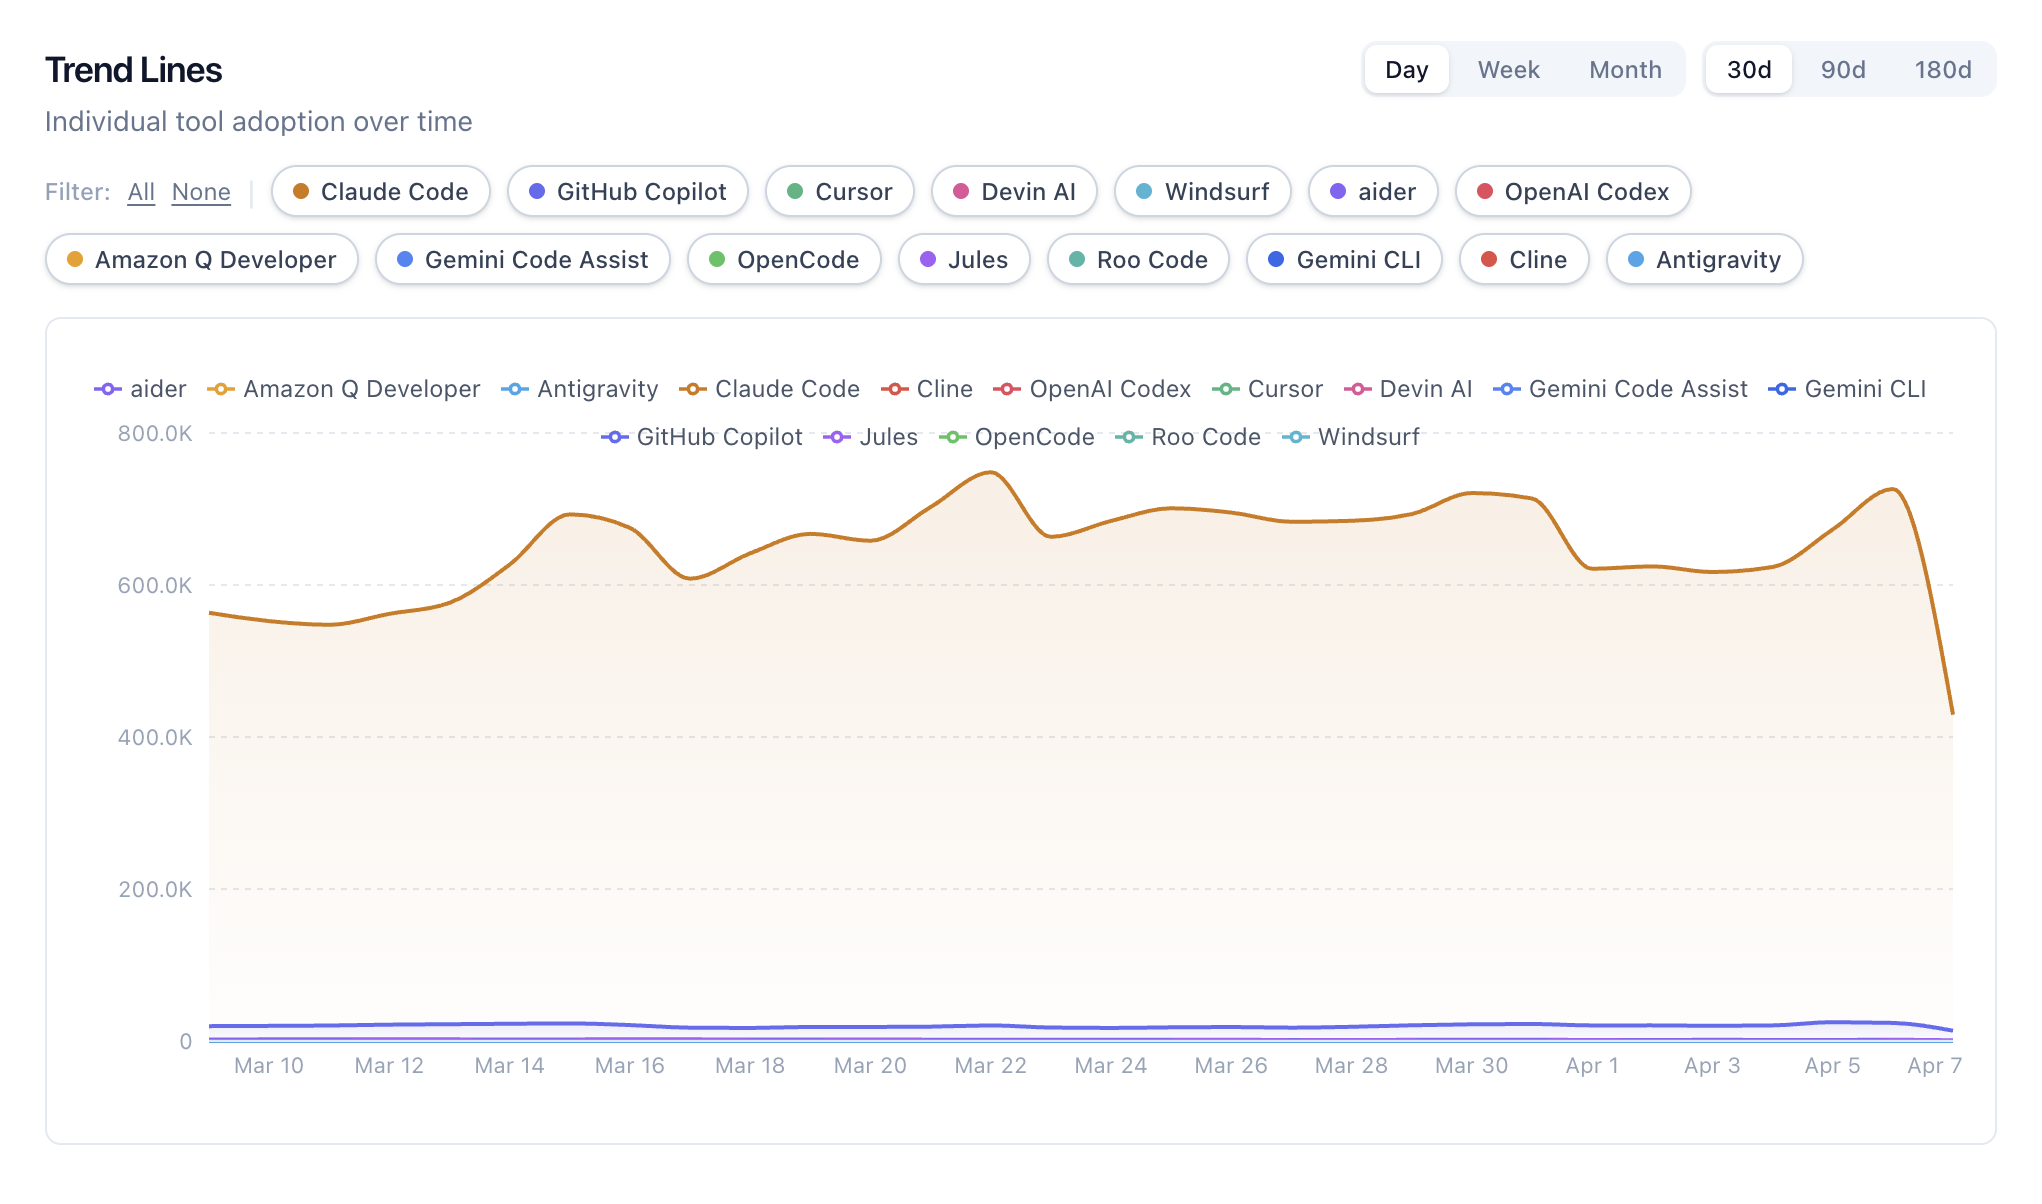
Looking at the per-tool trend lines, it's clear this isn't a winner take all situation. At least not yet. A few tools dominate the daily commit volume, but smaller tools keep showing up in the data and chipping away at the top spots.
Cumulative growth over time
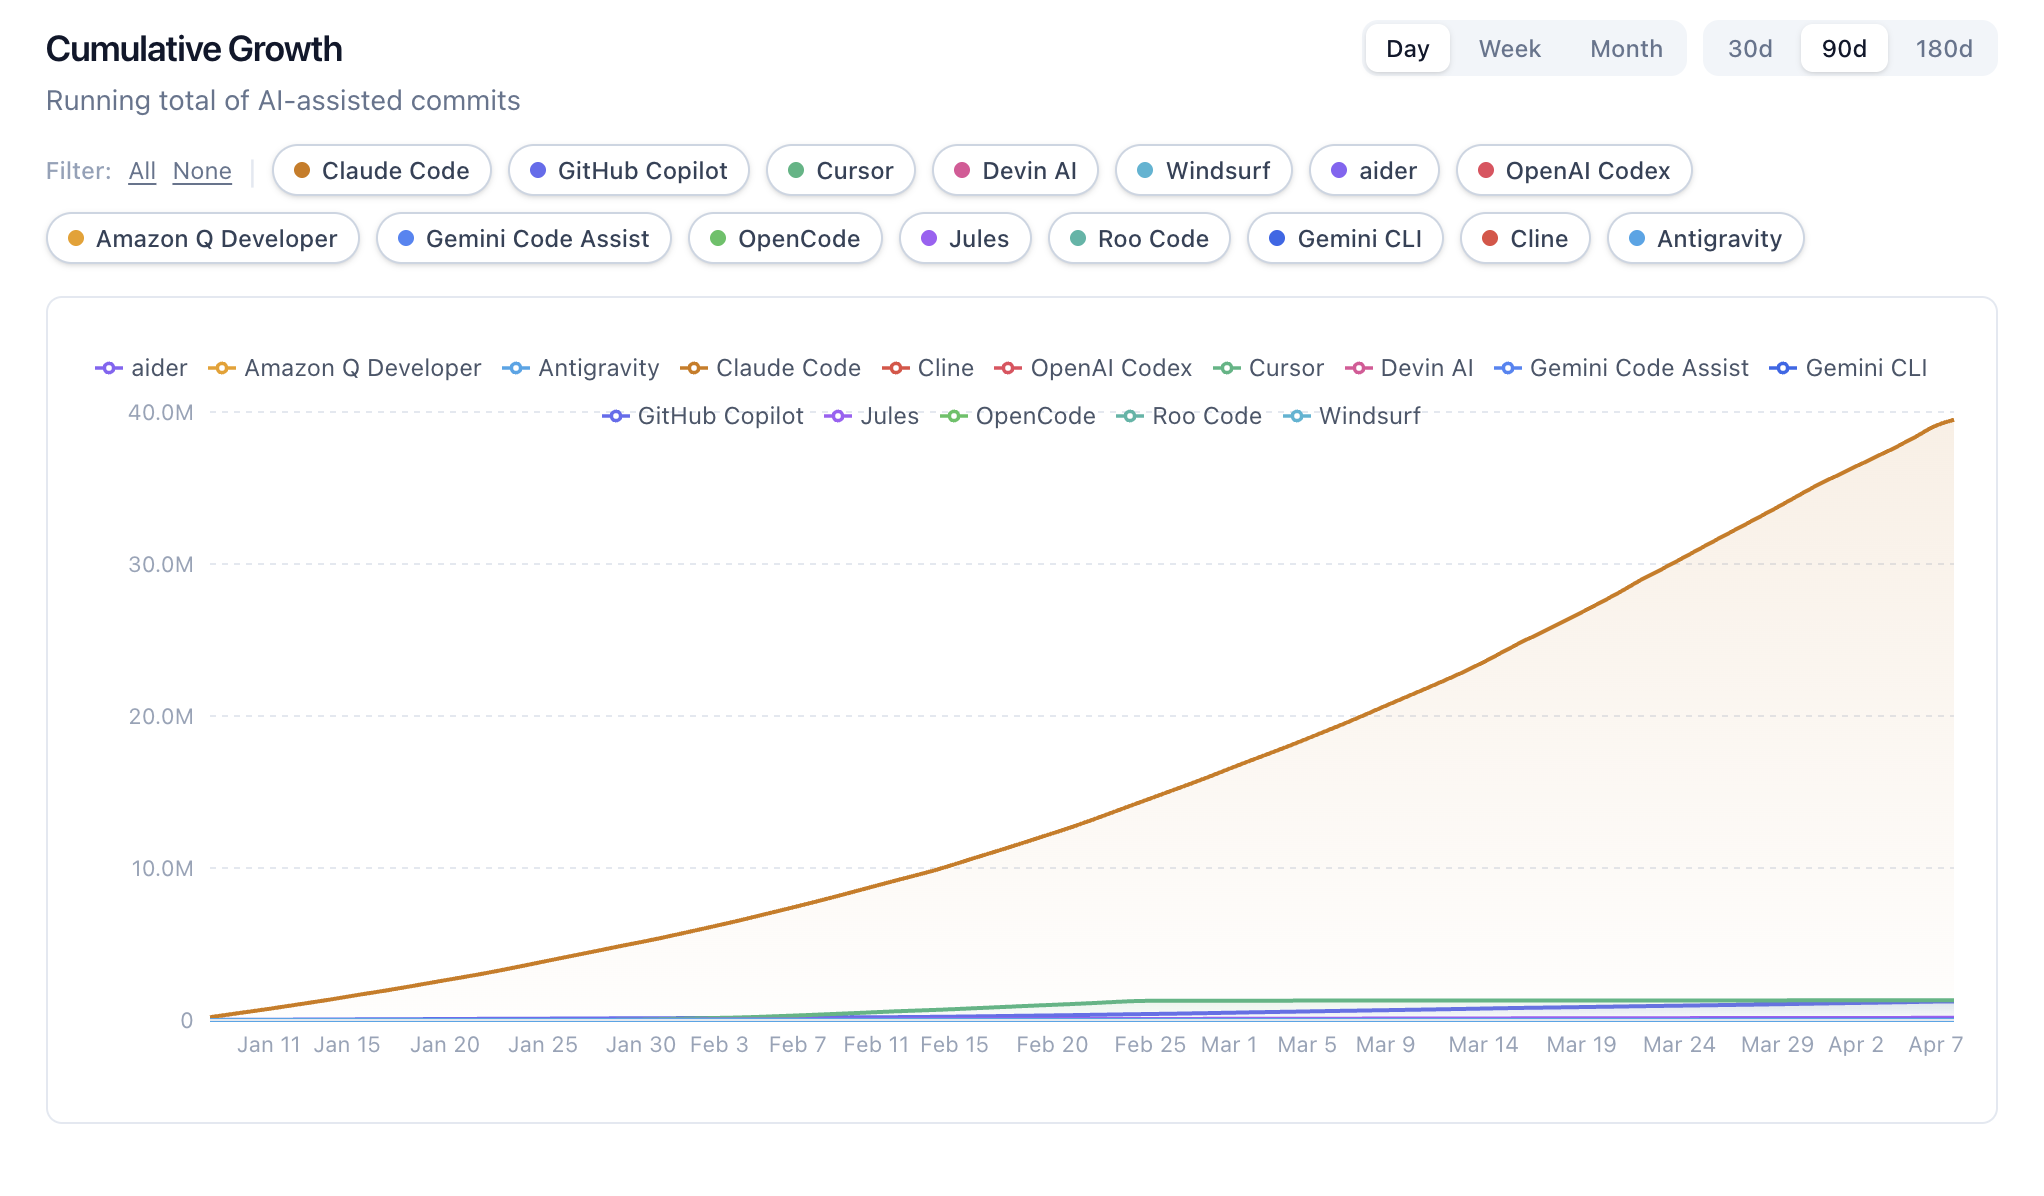
The cumulative view is great for seeing the big picture. You can spot exactly when certain tools launched or had a big adoption moment. Some of the growth curves are really striking when you look at them over the full 180 day window.
Being honest about the limitations
I think it's important to be upfront about what this data can and can't tell you.
What works well:
- Shows relative adoption trends over time
- Gives you a sense of which tools are gaining or losing momentum
- Based on actual usage signals, not opinions
- Refreshes automatically every 6 hours
What's imperfect:
- GitHub's Search API gives approximate counts. I run each query 3 times and take the max to smooth things out, but the numbers are estimates.
- Private repos are invisible. GitHub search only covers public repos. Enterprise usage (probably massive for Copilot) doesn't show up at all.
- Not every usage leaves a trace. If someone removes the co-author tag or uses a tool that doesn't add one, it won't be counted. Everything is undercounted to some degree.
- There's a 1,000 result cap per API query. For tools with millions of matches, the totals are approximations.
- Search index lag. GitHub's index can be behind by minutes to hours.
The best way to use this data is for relative comparisons and watching trends, not obsessing over exact numbers.
How I built it
I put this together over a weekend using Claude Code in like 1 hour (I know it sounds crazy). The backend is FastAPI with PostgreSQL, the frontend is Next.js, and everything runs in Docker. The GitHub API does most of the heavy lifting. I just had to figure out the right search queries and build a pipeline to store snapshots over time.
It's all open source under MIT if anyone wants to poke around, add a tool, or improve how detection works.
Take a look
The dashboard is live at dailyagents.ai. You can explore the rankings, dig into the trends, check out market share, and browse real example commits from each tool.
GitHub repo: github.com/deshraj/daily-agents
I'd love to know what you think. What patterns do you notice in the data? What tools are you using day to day?